
Ecoregion Locator and Interactive Maps
July 10th, 2019 by Alex Zorach
In the past several weeks, we have made much more rapid progress than we anticipated, in our work with ecoregions, geographic data, and maps. Key highlights are our new ecoregion locator tool, numerous interactive (clickable) maps, and integration of these regions into observation records and their photos. These accomplishments also pave the way towards development of ecoregion-based range maps of plant species.Here's an example of how the ecoregions are displayed on a photo page:
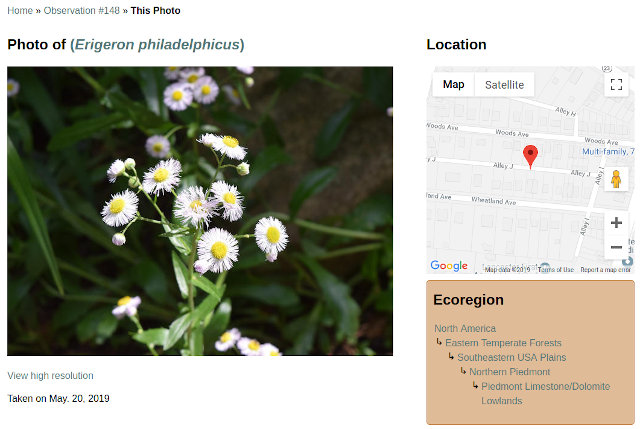 The pages for photos and observations now show a hierarchy of ecoregions in the case that the location is specified. This list is linked to the master page on each region, with maps and articles on each region. Observation pages show a similar box.
The box is color-coded to match the map colors, which match the colors used on the EPA's ecoregion maps. You can click the links to be taken to pages on each region; these will eventually have articles on each region. We have written many articles already.
The idea behind this integration is so that, as users submit or browse observations, they will be presented with clear information about the ecoregions these observations are in, along with an easy way to access articles where they can learn more about those regions.
Ecoregion Locator: Accessible to All
Our site's interactive features, including the posting of observations and photos, are still in a limited testing phase, available only to a small number of users. But, to make our ecoregions accessible to everyone, we published an ecoregion locator, in which you can pin a point on a map and it will show you the full hierarchy of ecoregions, with links to our pages on these regions: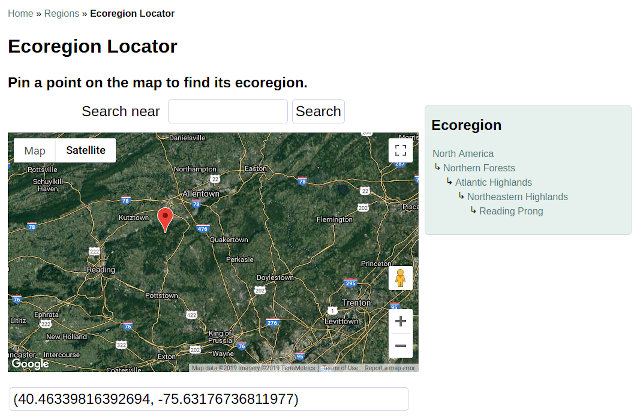 Our ecoregion locator is accessible to everyone; people do not need to be logged in to use it. It will show you the full hierarchy of ecoregions for any point in North America. Currently, the continental U.S. has one greater level of detail than Canada, Mexico, and Alaska.
You can use this tool to look up your own ecoregion, as well as the ecoregions of any locations in North America. Feel free to share this tool with others; we want it to reach as broad an audience as possible.
Interactive Ecoregion Maps
When we first announced ecoregions, we only had a single, clickable map for all of North America, and it lacked political boundaries. We have since imported information on state/province borders, and county boundaries in the U.S. as well, creating an overlay to the maps to make it visually clearer where these ecoregions are located relative to familiar political boundaries.These maps are SVG (Scalable Vector Graphics) files, which scale gracefully, but also have the added benefit that we can embed HTML links and styling in them, producing clickable maps with regions that change color and display region names when you hover your mouse over them. We have taken care to optimize these files so that they load and display quickly even on slower internet connections and older computers and mobile devices. These maps work on mobile devices, but some of their features are only available on desktop browsers with mouse pointers.
Here is one of the larger and more complex maps, that of the Eastern Temperate Forests:
Scanning this map, we can make some observations that may be familiar to people who have lived or traveled in these areas. For example, northeast Ohio looks a lot like New England and upstate New York, which makes sense as they are both part of the Mixed Wood Plains, and this area looks less like other regions of Ohio, which are in different ecoregions. Similarly, the topography and culture of the Ozarks in Arkansas and Missouri are similar to that in the Appalachian regions of Pennsylvania, West Virginia, and other states; these areas are both part of the same ecoregion. If you explore our maps, you can make all sorts of interesting observations like these.
Although our website is primarily about plants, you will find that these ecoregions often correspond to cultural and economic boundaries as well. You will also find discussion of these topics in our ecoregion articles, as they are directly relevant to the flora of an area, through factors like agriculture, forestry, and other human influences on the landscape.
What's to come: ecoregion-based range maps of plant species
The most exciting part about our recent progress with maps lies in how we generated the maps. Creating accurate, aesthetically-pleasing maps is normally labor-intensive. Rather than drawing maps from hand, or through a complex series of steps of exporting data from GIS software, we developed our own software to dynamically generate the maps in one step using data in our own database. This data is sourced from a variety of organizations, including the U.S. EPA, the Commission for Environmental Cooperation, the U.S. Census, and various other free data sources.In generating these maps, we have laid the groundwork for (instantly) dynamically-generating range maps for individual species, based on ecoregions rather than political boundaries. We are now able to automate the generation of maps based on table-based entries in our database.
The hierarchical organization of the regions will make the massive task of building range maps by ecoregion more manageable: we will begin by marking species as native or introduced for the continent of North America as a whole, and then proceed first to the more modest number of level 1 ecoregions, then proceeding to more detail as we are able. Some of this work is also already done for us, as the National Highway Administration has a database of many native plants corresponding to level 3 ecoregions.
We are aware of a few glitches.
Our ecoregion maps are a massive undertaking, and as one would expect, there are a few minor problems, including a few areas of land not currently included in ecoregions of all levels, as well as some inconsistencies between level 3 and level 4 regions which lead to a few problems on our maps of the level 3 regions.We are already aware of these issues and are working to correct them. Many of the problems stem from the fact that our data for US Level 4 ecoregions has been revised more recently than that for the CEC's level 3 ecoregion, but in order to fix these, we need to manually synthesize data from multiple sources, which is time-consuming. There are also some problems with points near shorelines not displaying in any regions. We are aware of these inconsistencies, but if you see any other problems that we are not aware of, please let us know!
Explore and share!
Please check out these new features for yourself, and please share them with others! You can start with our ecoregion locator, or browse our map of all of North America, clicking through to progressively finer levels of detail.Archive of All Blogs
How To Identify Plants, May 7th, 2026
The Bias Against Tall Plants, November 11th, 2025
A Focus on Goldenrods (Solidago sp.), July 23rd, 2025
Disturbance and its Role in Plant Habitat Preferences, May 29th, 2025
What "Native" or "Introduced" Mean: Myths and Misconceptions, March 11th, 2025
Smarter & More Informative Search Results, January 13th, 2025
The Effect of the 2024 US Election on Plant Biodiversity and bplant.org, October 30th, 2024
The Problems With Nursery-Bought Plants, And The Solutions, October 8th, 2024
More Databases Linked & Search Improvements for Scientific Names, July 9th, 2024
Choosing The Best Common Names For Plants: Challenges & Solutions, April 19th, 2024
Range Map & Taxonomic Update Progress, January 31st, 2024
Giving Thanks To Everyone We Rely On, November 22nd, 2023
Thinking More Deeply About Habitat, April 5th, 2023
2022 Year-End Summary: Successes & New Goals, February 15th, 2023
New Databases Linked: Flora of North America & NatureServe Explorer, November 11th, 2022
All Range Maps 2nd Generation, Taxonomic Updates, & Fundraising Goal Met!, September 29th, 2022
More Range Map Improvements, POWO Interlinking, And Notes Fields, June 7th, 2022
Ecoregion-Based Plant Lists and Search, March 30th, 2022
Progress Updates on Range Maps and More, February 10th, 2022
The Vision for bplant.org, December 9th, 2021
New Server: Software & Hardware, August 30th, 2021
More & Improved Plant Range Maps, July 19th, 2021
A Control Section for Invasive Plants, April 15th, 2021
Progress Bars & State Ecoregion Legends, March 11th, 2021
Our 2020 Achievements, February 9th, 2021
Interlinking Databases for Plant Research, November 11th, 2020
A New Homepage, Highlighting Our Articles, July 29th, 2020
A False Recovery, But North Carolina's Ecoregions are Complete!, June 9th, 2020
We're Back After COVID-19 Setbacks, April 3rd, 2020
Help Us Find Ecoregion Photos, February 27th, 2020
What We Achieved in 2019, December 30th, 2019
Plant Comparison and ID Guides, October 30th, 2019
We Are Now Accepting Donations, October 14th, 2019
US State Ecoregion Maps, New Footer, Ecoregion Article Progress, and References, September 19th, 2019
Tentative Range Maps of Native Plants, August 12th, 2019
Ecoregion Locator and Interactive Maps, July 10th, 2019
Using Ecoregions Over Political Boundaries, May 13th, 2019
How We Handle Wild vs Cultivated Plants, April 16th, 2019
A Blog To Keep People Updated On Our Progress, April 8th, 2019
Sign Up
Want to get notified of our progress? Sign up for the bplant.org interest list!