Using Ecoregions Over Political Boundaries
May 13th, 2019 by Alex Zorach
Interest in plants tends to have a regional focus, owing to how different plants naturally occur (and can be grown) in different climates. The flora of the west coast of North America is markedly different from that of the east coast, and on the east coast, there are many differences between what grows in the southeast and the northeast, or in the Appalachians vs. the coastal plain.When people discuss the distribution, cultivation requirements, and native vs. introduced status of plants, the discussion is often framed in terms of political boundaries. People ask questions like: "Is this plant native to the U.S.?" or "Is this plant native to Canada?" and when people get more specific, they might ask questions like: "Is this plant native to Colorado?" or "Is this plant native to Pulaski county, Arkansas?"
A lot of organizations publish plant lists for plants native to particular states, and some go down to the county level. There are also numerous organizations, interest groups, and online communities that focus on plants native to particular states. Almost every state has a native plant society too, but these organizations or clubs are divided along state borders.
Problems with using political boundaries
Plants don't care whether they're in Canada, the United States, or Mexico, or whether they're in Pennsylvania, Ohio, or Delaware, with a few minor exceptions for ways in which state policy might affect management regimes, such as highway maintenance or regulations on herbicides or runoff engineering. Plants are, however, directly affected by climate, soil type, and surrounding vegetation, and these things don't tend to follow political boundaries.Here we explore the main problems with using these divisions when studying or discussing local flora: poor correspondence to ecological boundaries, inconsistent size of political divisions, and arbitrary cutoffs for native vs. invasive status.
Large states cut across ecoregion boundaries.
For most states, the state boundaries make little sense ecologically. For example, the area around Erie, PA shares more in common with the area near Cleveland, OH than it does with Philadelphia, PA, which itself shares more in common with Trenton, NJ. This pattern is the rule, not the exception.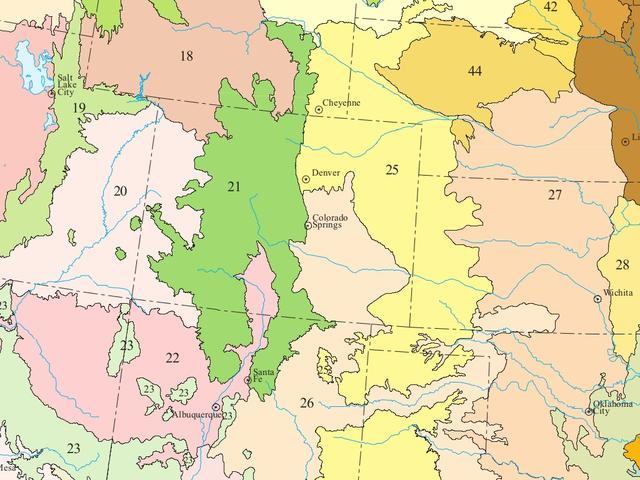 This map of Level III ecoregions published by the U.S. EPA shows how the ecological boundaries do not correspond even loosely to political boundaries. The contrast is particularly evident in the mountainous west.
In the west, where the climate differences are more pronounced, there are more glaring conflicts. The Sonoran desert covers sizeable corners of southeastern California and southwestern Arizona, and extends well into Mexico, whereas other regions like the Marine West Coast Forest of the Pacific northwest spans Northern California, through Oregon, Washington, and British Columbia (Canada), and into Alaska. Yet much of Washington state has a different mountainous climate, and the eastern part is desert.
States and counties are wildly inconsistent in size.
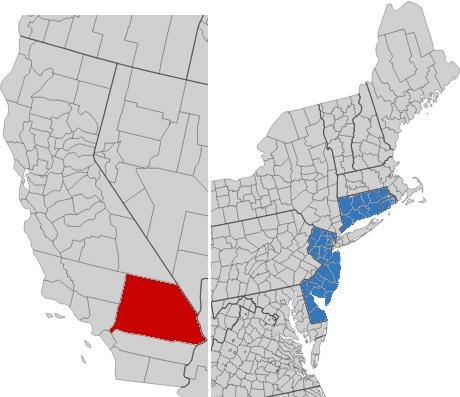 A size comparison shows San Bernardino County, CA is larger than the smallest four U.S. states combined! Incidentally, these states are divided into 37 counties in total.
Using state or county as basic units with which to track plant distribution also runs into the problem that the size of both counties and states varies hugely from one state to the next. County size can even vary siginficantly within the same state. Some states, like Georgia, Kentucky, or Indiana, have numerous, small counties, whereas others, like Maine, Nevada, or Arizona, have fewer, large counties. In sparsely-populated areas, counties tend to be large, and in the West, this results in most counties spanning radically different ecoregions. An extreme case of how arbitrary political boundary size can be is how San Bernardino County, CA, is not only larger than each of the nine smallest states of the U.S., but is larger than the four smallest states combined. There are 47 counties in the U.S. that are larger than each of the three smallest states!
The ratio of the largest to smallest U.S. state by area is over 430:1. For counties, excluding independent cities, Hawaii, and other urban counties, the ratio for counties is over 834:1. These inconsistencies make these divisions poorly suited as units for the study or reporting of plants or any living organisms.
Political boundaries lead to arbitrary judgments of plants as native vs. introduced.
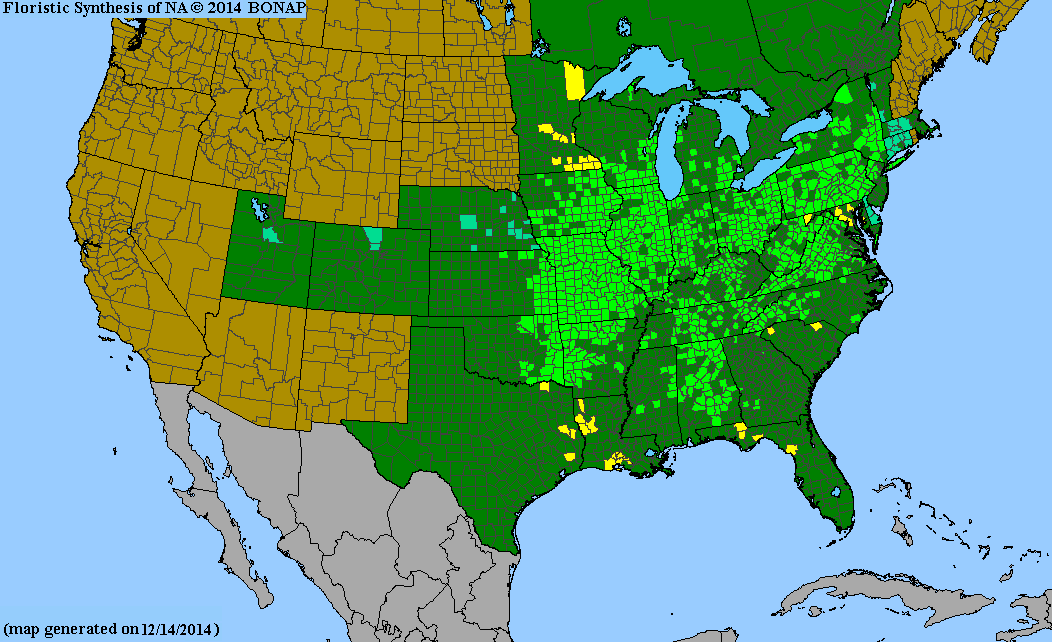
Yet another problem that can arise from using political boundaries is when they are used to make judgments or classifications of plants as being native vs. introduced or invasive. These classifications in turn drive real-world decisions of people to plant or remove various species from their property or in managed wild areas.The USDA Plant Profiles classify most plants as native or introduced on the level of countries rather than ecoregions. We thus find absurdities like the USDA's distribution map for Rudbeckia triloba, which considers Rudbeckia triloba native to the U.S. but introduced in Canada. A more accurate take is provided by the Biota of North America Project (BONAP), whose map shows this species as native to much of the U.S., but adventive (expanding not far from to its native range) in certain regions.
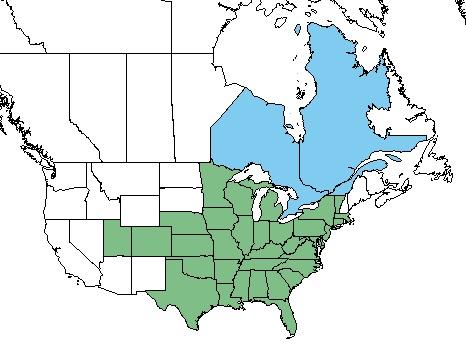 This USDA range map for Rudbeckia triloba shows the rather absurd classification of this species being "native" in every state of the U.S. in which it occurs, but "introduced" in Canada. BONAP, with more accurate data, classifies it as adventive (not originally found, but expanded into) NE, CO, and UT as well as eastern states like DE, CT, and MA.
The USDA's site is full of examples like this, but perhaps more importantly, these ways of thinking about a plant's status as native or introduced influence many organizations' plant lists, classifying some as native, others as invasive, often tainted by these political boundaries.
These lists in turn influence things like which plants nurseries stock and how they label or market them. They also shape what people plant intentionally, vs. expend resources to control or remove. As an example, we get people planting species like Douglas Fir on the east coast as a "native" plant, when its native range is limited to the Pacific northwest and Rocky mountains and it is being introduced discontinuously with its native range, across a large geographic divide. On the other hand we have the black locust, Robinia pseudoacacia, often classified as invasive in Canada even though it expanded contiguously with its native range, yet classified as native in regions bordering Canada in which it did not naturally occur.
Why is using political boundaries the norm?
One main reason for the use of political boundaries is convenience and habit. Through education, widely published maps, and the mere fact of living in a society where these boundaries have consequences for our lives, people tend to be highly aware of political boundaries. These borders can also be central in people's sense of identity, particularly with nationality, but also state or province, and even more local political boundaries like counties.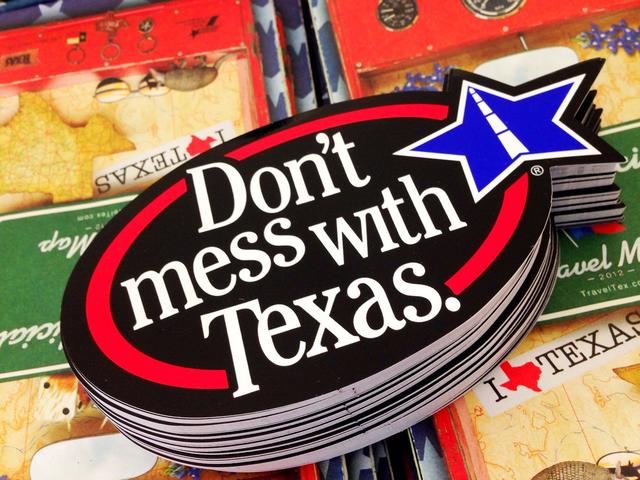 People often develop a sense of personal identity associated with political divisions. This is true not only of nationality, but certain states in particular. Photo © Texas State Library and Archives Commission Follow, CC BY 2.0.
A second reason, however, is that much of the research on plants, and on nature in general, and the funding for documenting and protecting organisms and wild ecosystems, is provided by governments. Especially when this work is carried out by state agencies, the documentation and research on particular species tends to be broken down along state lines. This compartmentalization is magnified by the entrenched legal tradition of states rights in the U.S., with individual states carrying out roles that are handled at the national level elsewhere in the world.
Our Approach: Emphasize Ecological Boundaries
On bplant.org, we use ecological boundaries rather than political boundaries for all purposes except those where the political boundaries are relevant, such as if certain plants occur on a state's noxious weeds list but not others. We seek to de-emphasize state and other political boundaries, and continually steer people in the direction of using, being aware of, and understanding ecoregions when discussing local flora.We have adopted a hierarchical organization of regions based on the collaborative efforts of the US EPA, the Comission for Environmental Cooperation, and INEGI in Mexico. This work grew out of a classification scheme published by James M. Omernik in 1987, while working for U.S. Geological Survey. These regions cover North America from all of Mexico north through Canada. The continent is divided broadly into 15 level I ecoregions, which are in turn divided into 50 level II ecoregions, 182 level III ecoregions, and 967 level IV ecoregions. The level II regions cover all of North America, whereas levels III and IV are only specified for locations within the United States. However, there are corresponding concepts for Canada and Mexico maintained by the governments of those countries as well.
The Level I regions correspond to major differences in climate, vegetation/cover, and ecosystem type and dynamics, what is usually called a biome. The greater levels of detail introduce finer distinctions that correspond to progressively subtler distinctions in climate, geography, and soil type, as well as the respective changes in ecosystems.
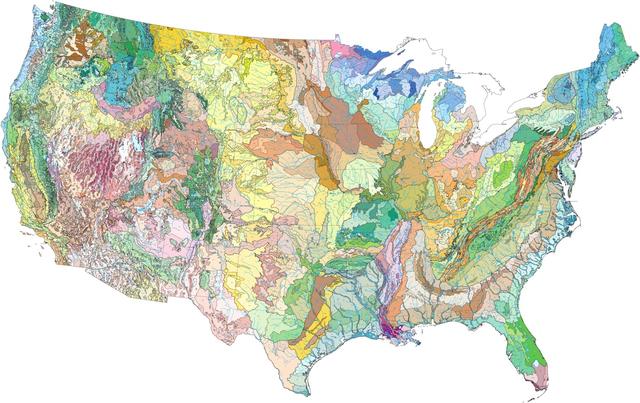 This map shows Level IV ecoregions of the U.S., offering an extraordinarily fine level of detail of the different ecological boundaries in the United States.
Plant ranges do not always correspond neatly to these regions, but the regions represent a much better match to the range and distribution of plants than is represented by political boundaries. Although there are fewer level IV ecoregions than U.S. counties, the fact that the borders are defined by geological, ecological, and climatic features rather than political ones (which are often the result of historical accidents) makes them far superior for the purposes of tracking, describing, and studying the occurrence of plant species.
We plan on building our range maps, as well as notices on observations that classify organisms as native, adventive, introduced, or extirpated, based on ecoregions. We also plan to enable searching, filtering, and generation of plant lists by ecoregion, providing tools to browse, explore, and learn about the various regions.
One of our key hopes is that, as a non-governmental organization, we will not be constrained by national or state boundaries, and we can thus build a body of work that will be more effective both for understanding, and for preserving and protecting plant biodiversity.
Because this undertaking is massive, we are starting at the coarsest level, documenting which plants are native or introduced on the level of the whole continent, and then over time, proceed to adding greater detail. In many cases, the native vs. introduced status of a plant in a broad (level I) ecoregion already provides a better idea of whether the plant functions more like a native or introduced plant in a particular region, relative to using state boundaries.
You can learn more about these regions by exploring our regions section, which takes you to an interactive map of the ecoregions of North America, with articles and photos for each region. We currently have the capacity to identify user observations to the level of Level II ecoregions and are hoping to expand this soon. Please explore what we have now, and stay tuned for more detail!
Archive of All Blogs
How To Identify Plants, May 7th, 2026
The Bias Against Tall Plants, November 11th, 2025
A Focus on Goldenrods (Solidago sp.), July 23rd, 2025
Disturbance and its Role in Plant Habitat Preferences, May 29th, 2025
What "Native" or "Introduced" Mean: Myths and Misconceptions, March 11th, 2025
Smarter & More Informative Search Results, January 13th, 2025
The Effect of the 2024 US Election on Plant Biodiversity and bplant.org, October 30th, 2024
The Problems With Nursery-Bought Plants, And The Solutions, October 8th, 2024
More Databases Linked & Search Improvements for Scientific Names, July 9th, 2024
Choosing The Best Common Names For Plants: Challenges & Solutions, April 19th, 2024
Range Map & Taxonomic Update Progress, January 31st, 2024
Giving Thanks To Everyone We Rely On, November 22nd, 2023
Thinking More Deeply About Habitat, April 5th, 2023
2022 Year-End Summary: Successes & New Goals, February 15th, 2023
New Databases Linked: Flora of North America & NatureServe Explorer, November 11th, 2022
All Range Maps 2nd Generation, Taxonomic Updates, & Fundraising Goal Met!, September 29th, 2022
More Range Map Improvements, POWO Interlinking, And Notes Fields, June 7th, 2022
Ecoregion-Based Plant Lists and Search, March 30th, 2022
Progress Updates on Range Maps and More, February 10th, 2022
The Vision for bplant.org, December 9th, 2021
New Server: Software & Hardware, August 30th, 2021
More & Improved Plant Range Maps, July 19th, 2021
A Control Section for Invasive Plants, April 15th, 2021
Progress Bars & State Ecoregion Legends, March 11th, 2021
Our 2020 Achievements, February 9th, 2021
Interlinking Databases for Plant Research, November 11th, 2020
A New Homepage, Highlighting Our Articles, July 29th, 2020
A False Recovery, But North Carolina's Ecoregions are Complete!, June 9th, 2020
We're Back After COVID-19 Setbacks, April 3rd, 2020
Help Us Find Ecoregion Photos, February 27th, 2020
What We Achieved in 2019, December 30th, 2019
Plant Comparison and ID Guides, October 30th, 2019
We Are Now Accepting Donations, October 14th, 2019
US State Ecoregion Maps, New Footer, Ecoregion Article Progress, and References, September 19th, 2019
Tentative Range Maps of Native Plants, August 12th, 2019
Ecoregion Locator and Interactive Maps, July 10th, 2019
Using Ecoregions Over Political Boundaries, May 13th, 2019
How We Handle Wild vs Cultivated Plants, April 16th, 2019
A Blog To Keep People Updated On Our Progress, April 8th, 2019
Sign Up
Want to get notified of our progress? Sign up for the bplant.org interest list!